
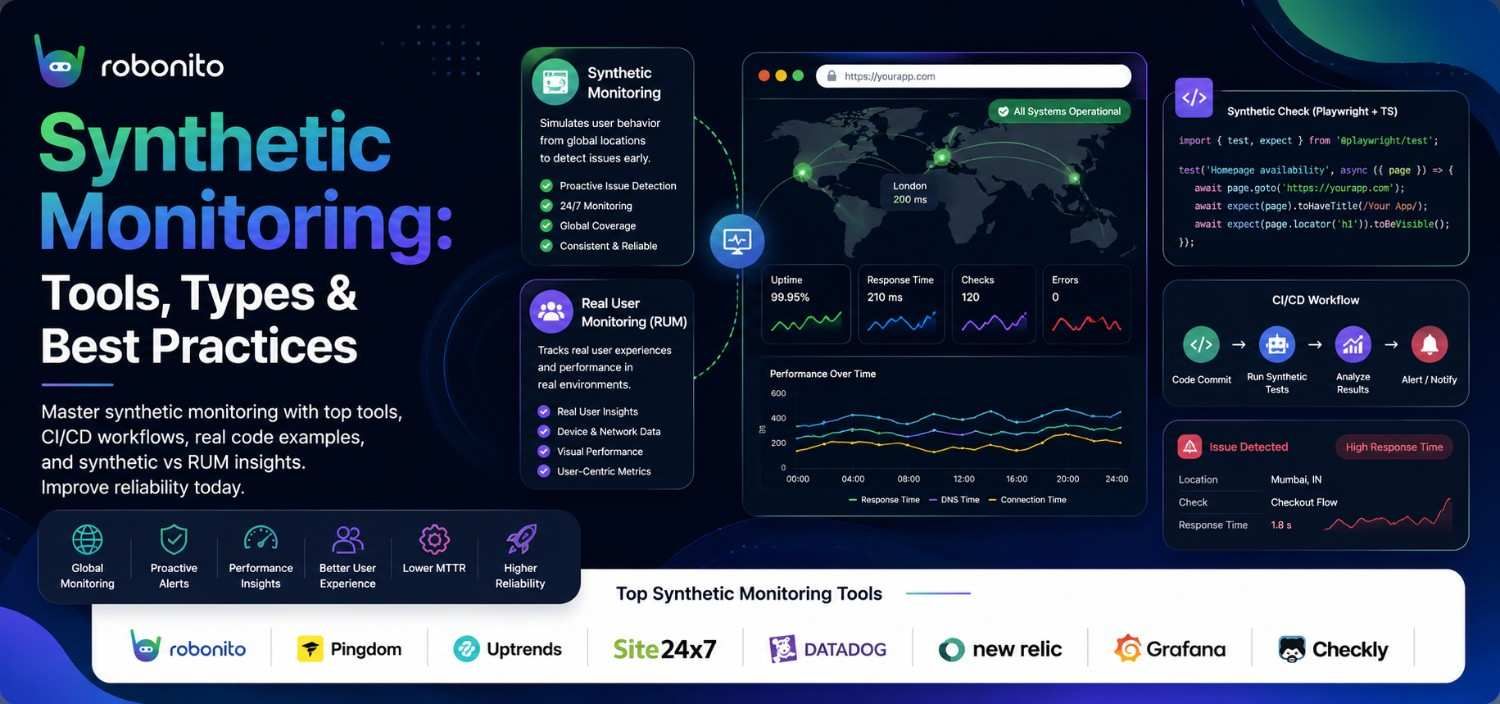
Your users do not wait for business hours to encounter outages. Your monitoring should not either. Synthetic monitoring watches your application around the clock from every geography — detecting broken flows, degraded performance, and complete outages before a single real user is affected.
By Robonito Engineering Team · Updated May 2026 · 17 min read
The problem synthetic monitoring solves
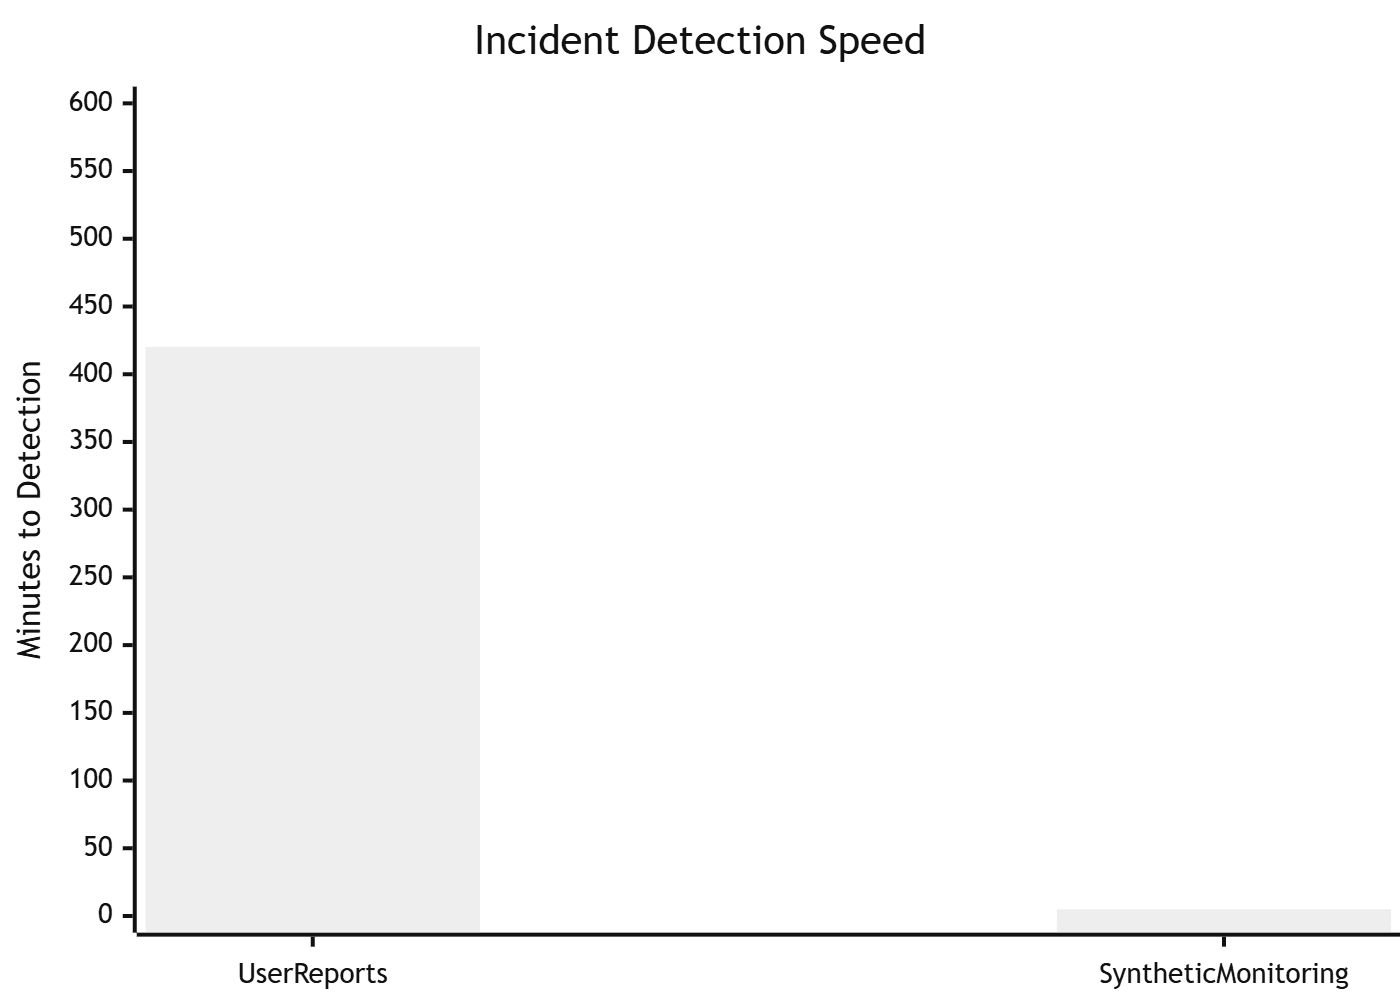
Here is a scenario that happens to every engineering team eventually. A deployment goes out at 11pm. Everything looks fine — no exceptions in the logs, no alerts firing, the health check endpoint returns 200. The on-call engineer goes to sleep.
At 2am, a database migration that ran alongside the deployment quietly corrupted the checkout flow for users paying with saved payment methods. No exception. No 500 error. The flow just silently fails — a 200 response with the wrong outcome. The first person to notice is a customer who emails support at 9am.
Seven hours of broken checkout. Real money. Real customers. And nothing in your existing monitoring caught it.
This is exactly the scenario synthetic monitoring is designed to prevent. A synthetic transaction monitor running a scripted checkout every five minutes — including the saved payment method flow — would have caught the failure at 2:05am and paged the on-call engineer before the first real customer was affected.
Synthetic monitoring is not a replacement for logs, metrics, or real user monitoring. It is the proactive layer that actively verifies critical user flows are working correctly, from the user's perspective, 24 hours a day.
Quick stats
| Fact | Source |
|---|---|
| Average cost of 1 hour of application downtime: $300,000 | Gartner |
| 53% of users abandon sites taking over 3 seconds to load | |
| Synthetic monitoring detects outages 73% faster than user reports | Forrester |
| Teams using synthetic monitoring resolve incidents 2.3× faster | PagerDuty State of Digital Operations 2025 |
| 60% of revenue-impacting incidents are caught by synthetic checks | Datadog State of Observability 2025 |
Table of Contents
- What is synthetic monitoring?
- Synthetic monitoring vs Real User Monitoring (RUM)
- The four types of synthetic monitoring
- Real code examples for every type
- Best synthetic monitoring tools in 2026
- Synthetic monitoring in CI/CD
- What to monitor — and from where
- Alerting strategy
- Common mistakes and how to avoid them
- Pre-launch synthetic monitoring checklist
- Frequently Asked Questions
Know your critical user flows are working before your users tell you they are not
Robonito auto-generates synthetic transaction monitors from your real user flows — running in CI and in production, alerting your team the moment something breaks. Try Robonito free →
1. What is synthetic monitoring?

Synthetic monitoring is the practice of running scripted, simulated user interactions against your application on a fixed schedule — from multiple geographic locations — to proactively detect performance degradation, broken user flows, and outages before real users encounter them.
The word "synthetic" is key. These are not real users. They are scripted bots that execute predefined sequences of actions — visit this URL, click this button, fill this form, verify this element appears — and report whether the sequence completed successfully, how long each step took, and where it failed if it did not complete.
Because synthetic checks run on a schedule regardless of real user activity, they provide continuous baseline measurements and catch problems that occur during low-traffic periods — nights, weekends, holidays — when real user monitoring would generate no signal.
One-sentence definition: Synthetic monitoring runs scripted simulations of user interactions on a schedule to proactively detect performance issues and broken flows before real users are affected.
What synthetic monitoring is not
Synthetic monitoring does not replace logs, metrics, error tracking (Sentry), real user monitoring (RUM), or APM (Application Performance Monitoring). It is one layer in an observability stack, and it specifically fills the gap that other tools leave: proactive verification that critical user journeys work end-to-end, from the user's perspective, continuously.
2. Synthetic monitoring vs Real User Monitoring (RUM)
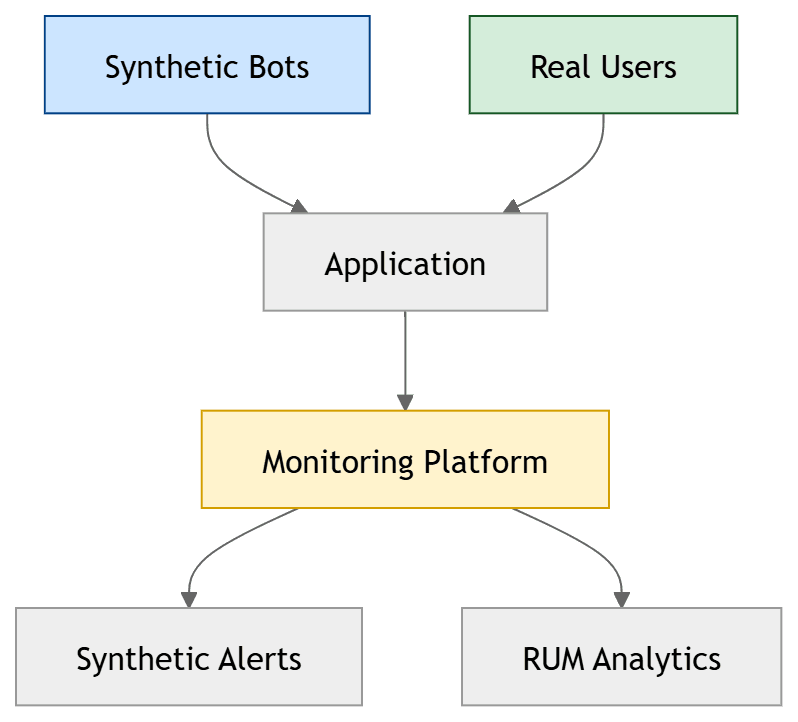
This is the most important comparison to understand before investing in either.
| Dimension | Synthetic monitoring | Real User Monitoring (RUM) |
|---|---|---|
| Data source | Scripted bots on a schedule | Real user sessions |
| When it runs | 24/7 regardless of traffic | Only when users are active |
| What it catches | Known critical flows, always | Real behaviour, all flows |
| Consistency | Same script every run | Varies by user behaviour |
| Blind spots | Flows not in the script | Off-hours, low-traffic incidents |
| Alert speed | Immediate (catches off-hours) | Delayed (needs user traffic) |
| Geographic testing | Explicit (run from any location) | Reflects actual user locations |
| Best tools | Checkly, Datadog Synthetics, New Relic | Google Analytics, Datadog RUM, Sentry |
| Primary use | Proactive alerting, SLA verification | Experience analysis, journey optimisation |
The honest answer: you need both
Synthetic monitoring and RUM answer fundamentally different questions. Synthetic tells you "is the login flow working right now from Frankfurt?" RUM tells you "what is the 95th percentile load time for real users in Germany this week?"
Synthetic monitoring is your smoke alarm — it tells you immediately when something is broken. RUM is your air quality monitor — it tells you about gradual degradation trends in real user experience.
Teams that run only synthetic monitoring miss the long-tail performance issues that real users experience but scripts do not catch. Teams that run only RUM miss off-hours outages entirely. The combination — synthetic for alerting, RUM for analysis — is the observability standard for production-critical applications.
3. The four types of synthetic monitoring
3.1 Uptime / API monitoring
What it does: Sends an HTTP request to an endpoint on a schedule and verifies it responds within an acceptable time with the expected status code. The simplest and most fundamental form of synthetic monitoring.
What it catches: Complete outages, slow response times, SSL certificate expiry, DNS failures, unexpected status codes (503 instead of 200).
What it misses: Application-level failures where the endpoint returns 200 but the response content is wrong or incomplete.
Check frequency: Every 1–5 minutes for production APIs. Every 30 seconds for payment-critical endpoints.
3.2 Browser synthetic monitoring
What it does: Launches a real browser (Chromium, Firefox, or WebKit), loads your pages, and measures Core Web Vitals — LCP, INP, CLS — along with JavaScript errors, failed network requests, and rendering performance. Provides a screenshot and waterfall diagram for every check.
What it catches: Frontend rendering failures, JavaScript errors that break page functionality, slow page loads caused by third-party scripts, visual regressions that break layout, CDN failures.
What it misses: Application logic failures that do not affect page rendering.
Check frequency: Every 5–15 minutes for critical pages (homepage, pricing, checkout).
3.3 Transaction monitoring (multi-step flows)
What it does: Runs a scripted multi-step user journey — login → search → add to cart → checkout → confirmation — verifying each step completes successfully and within acceptable time. This is the most powerful and most valuable type of synthetic monitoring.
What it catches: Broken user flows, failed integrations (payment processors, email services, third-party APIs), regression in critical business workflows, subtle failures where steps complete but with wrong outcomes.
What it misses: Nothing in the scripted flow — which is why defining the right flows is critical.
Check frequency: Every 5–15 minutes for checkout, login, and onboarding flows.
3.4 API synthetic monitoring
What it does: Tests your API endpoints on a schedule — not just for uptime but for correctness. Verifies response schemas match expectations, response times meet SLA targets, authentication works correctly, and business logic returns correct results.
What it catches: Breaking API changes, schema drift, performance regressions in API response times, authentication failures, third-party API degradation affecting your application.
Check frequency: Every 1–5 minutes for production API endpoints.
4. Real code examples for every type
4.1 API uptime check with Checkly
// checkly.config.ts — monitoring-as-code with Checkly
import { ApiCheck, AssertionBuilder } from 'checkly/constructs';

// Simple API health check — runs every 2 minutes from 5 regions
new ApiCheck('api-health-check', {
  name: 'API Health Check',
  activated: true,
  muted: false,
  request: {
    url: 'https://api.yourapp.com/v1/health',
    method: 'GET',
    headers: [{ key: 'Accept', value: 'application/json' }],
    assertions: [
      AssertionBuilder.statusCode().equals(200),
      AssertionBuilder.responseTime().lessThan(500),
      AssertionBuilder.jsonBody('$.status').equals('healthy'),
    ],
  },
  locations: ['us-east-1', 'eu-west-1', 'ap-southeast-1'],
  frequency: 2, // minutes
  alertChannels: [],
});

// API endpoint check with authentication
new ApiCheck('products-api-check', {
  name: 'Products API — authenticated',
  request: {
    url: 'https://api.yourapp.com/v1/products?limit=10',
    method: 'GET',
    headers: [
      { key: 'Authorization', value: `Bearer ${process.env.SYNTHETIC_API_TOKEN}` },
      { key: 'Content-Type', value: 'application/json' },
    ],
    assertions: [
      AssertionBuilder.statusCode().equals(200),
      AssertionBuilder.responseTime().lessThan(800),
      AssertionBuilder.jsonBody('$.products').isArray(),
      AssertionBuilder.jsonBody('$.products.length').greaterThan(0),
      // Schema check — ensure required fields are present
      AssertionBuilder.jsonBody('$.products[0].id').isNotNull(),
      AssertionBuilder.jsonBody('$.products[0].price').isNotNull(),
    ],
  },
  locations: ['us-east-1', 'eu-west-1'],
  frequency: 5,
});
4.2 Browser synthetic monitoring with Playwright + Checkly
// __checks__/homepage.check.ts
import { BrowserCheck, Frequency } from 'checkly/constructs';

new BrowserCheck('homepage-browser-check', {
  name: 'Homepage — Core Web Vitals',
  activated: true,
  frequency: Frequency.EVERY_10M,
  locations: ['us-east-1', 'eu-west-1', 'ap-southeast-1'],
  code: {
    entrypoint: './homepage.spec.ts',
  },
});
// __checks__/homepage.spec.ts — runs in real Chromium browser
import { test, expect } from '@playwright/test';

test('homepage loads correctly with acceptable performance', async ({ page }) => {
  // Start measuring Core Web Vitals
  await page.goto('https://yourapp.com', { waitUntil: 'networkidle' });

  // Verify critical content is visible
  await expect(page.getByRole('heading', { level: 1 })).toBeVisible();
  await expect(page.getByRole('navigation')).toBeVisible();
  await expect(page.getByRole('link', { name: 'Get started' })).toBeVisible();

  // Verify no JavaScript errors occurred during load
  const jsErrors: string[] = [];
  page.on('pageerror', (error) => jsErrors.push(error.message));
  expect(jsErrors).toHaveLength(0);

  // Verify Core Web Vitals via Performance API
  const lcp = await page.evaluate(() => {
    return new Promise<number>((resolve) => {
      new PerformanceObserver((list) => {
        const entries = list.getEntries();
        resolve(entries[entries.length - 1].startTime);
      }).observe({ type: 'largest-contentful-paint', buffered: true });
    });
  });

  // LCP should be under 2500ms (Google "Good" threshold)
  expect(lcp).toBeLessThan(2500);

  // Take screenshot for visual verification
  await page.screenshot({ path: 'homepage-check.png', fullPage: false });
});
4.3 Transaction monitoring — full checkout flow
// __checks__/checkout-flow.spec.ts — critical transaction monitor
import { test, expect } from '@playwright/test';

test('complete checkout flow — guest user', async ({ page }) => {
  // Step 1: Browse to product page
  await page.goto('https://yourapp.com/products/widget-pro');
  await expect(page.getByRole('heading', { name: 'Widget Pro' })).toBeVisible();
  await expect(page.getByTestId('product-price')).toBeVisible();

  // Step 2: Add to cart
  await page.getByRole('button', { name: 'Add to cart' }).click();
  await expect(page.getByTestId('cart-count')).toHaveText('1');

  // Step 3: Go to checkout
  await page.getByRole('link', { name: 'Checkout' }).click();
  await expect(page).toHaveURL(/\/checkout/);

  // Step 4: Fill guest checkout form
  await page.getByLabel('Email').fill('synthetic-test@yourapp.com');
  await page.getByLabel('Full name').fill('Synthetic Monitor');
  await page.getByLabel('Address').fill('123 Test Street');
  await page.getByLabel('City').fill('San Francisco');
  await page.getByLabel('Postal code').fill('94105');

  // Step 5: Select shipping
  await page.getByLabel('Standard shipping').check();

  // Step 6: Verify order summary is correct
  const summaryTotal = page.getByTestId('order-total');
  await expect(summaryTotal).toBeVisible();
  await expect(summaryTotal).not.toHaveText('$0.00');

  // Step 7: Verify payment form loads (Stripe iframe)
  const stripeFrame = page.frameLocator('[title="Secure payment input frame"]');
  await expect(stripeFrame.getByPlaceholder('Card number')).toBeVisible({ timeout: 10000 });

  // Note: In synthetic monitoring, we typically stop before actual payment submission
  // to avoid creating real transactions. Verify the form is functional and accessible.
  // For full transaction testing, use a Stripe test card in a sandbox environment.

  // Final assertion: page title reflects checkout context
  await expect(page).toHaveTitle(/checkout/i);
});
4.4 API synthetic monitoring with schema validation
// api-checks/orders-api.check.js — Checkly API check with schema validation
import { ApiCheck, AssertionBuilder } from 'checkly/constructs';
import Ajv from 'ajv';

// JSON Schema for the orders API response
const ordersResponseSchema = {
  type: 'object',
  required: ['orders', 'total', 'page'],
  properties: {
    orders: {
      type: 'array',
      items: {
        type: 'object',
        required: ['id', 'status', 'total', 'created_at'],
        properties: {
          id: { type: 'string' },
          status: { enum: ['pending', 'processing', 'shipped', 'delivered', 'cancelled'] },
          total: { type: 'number', minimum: 0 },
          created_at: { type: 'string', format: 'date-time' },
        },
      },
    },
    total: { type: 'integer', minimum: 0 },
    page: { type: 'integer', minimum: 1 },
  },
};

new ApiCheck('orders-api-schema-check', {
  name: 'Orders API — schema validation',
  request: {
    url: 'https://api.yourapp.com/v1/orders?page=1&limit=10',
    method: 'GET',
    headers: [
      { key: 'Authorization', value: `Bearer ${process.env.SYNTHETIC_API_TOKEN}` },
    ],
    assertions: [
      AssertionBuilder.statusCode().equals(200),
      AssertionBuilder.responseTime().lessThan(600),
      AssertionBuilder.jsonBody('$.orders').isArray(),
      // Custom schema validation via setup script
    ],
  },
  setupScript: {
    content: `
      // Validate response schema matches expected structure
      const ajv = require('ajv');
      const validate = new ajv().compile(${JSON.stringify(ordersResponseSchema)});
      const isValid = validate(JSON.parse(response.body));
      if (!isValid) {
        throw new Error('Orders API schema violation: ' + JSON.stringify(validate.errors));
      }
    `,
  },
  locations: ['us-east-1', 'eu-west-1'],
  frequency: 5,
});
5. Best synthetic monitoring tools in 2026
Tool comparison matrix
| Tool | Browser checks | API checks | Transaction scripts | Monitoring-as-code | CI/CD native | Free tier | Pricing from |
|---|---|---|---|---|---|---|---|
| Checkly | ✅ Playwright | ✅ | ✅ | ✅ Best-in-class | ✅ | ✅ | $0 / ~$30/mo paid |
| Datadog Synthetics | ✅ | ✅ | ✅ | ✅ Terraform | ✅ | ❌ | ~$5/1000 runs |
| New Relic Synthetics | ✅ | ✅ | ✅ | ⚠️ Limited | ✅ | ✅ (limited) | ~$0.005/check |
| Grafana k6 Cloud | ✅ Browser | ✅ | ✅ | ✅ k6 scripts | ✅ | ✅ | $0 OSS / Cloud paid |
| Pingdom | ✅ | ✅ | ✅ | ❌ | ✅ | ❌ | ~$15/mo |
| Uptime Robot | ❌ | ✅ Basic | ❌ | ❌ | ⚠️ | ✅ | Free / $7/mo |
| Robonito | ✅ | ✅ | ✅ Auto-generated | ✅ | ✅ | ✅ | Free |
Choosing the right tool
Choose Checkly if you want monitoring-as-code — defining your synthetic checks in the same repository as your application code, reviewed in PRs, versioned in Git, deployed alongside your application. The Playwright integration for browser checks is the most developer-friendly in the market. This is the tool most engineering teams would choose in 2026 if starting fresh.
Choose Datadog Synthetics if your team is already using Datadog for APM, infrastructure monitoring, and log management. The value is in correlation — a synthetic failure that triggers an alert alongside the APM trace and infrastructure metrics that explain why it failed. The integrated observability story is Datadog's primary advantage.
Choose New Relic Synthetics for the same reason — if New Relic is your observability platform of choice. The free tier is genuinely useful for smaller teams.
Choose Uptime Robot if you need basic HTTP uptime monitoring only, budget is the primary constraint, and your team does not need browser transaction scripts. It is the simplest and cheapest option for basic "is this URL responding?" checks.
Choose Robonito if you want synthetic transaction monitors auto-generated from your real user flows — the same tests that run in your CI pipeline as functional tests can also run as production synthetic monitors, without writing separate monitoring scripts.
6. Synthetic monitoring in CI/CD

The most sophisticated synthetic monitoring strategy runs your checks in three contexts: as pre-deployment validation in CI, as post-deployment smoke verification after every release, and as continuous production monitors running on a schedule.
Pre-deployment check in GitHub Actions
## .github/workflows/synthetic-checks.yml
name: Synthetic Monitoring — Pre & Post Deploy

on:
  deployment_status:

jobs:
  post-deploy-synthetic:
    name: Post-deployment synthetic verification
    runs-on: ubuntu-latest
    if: github.event.deployment_status.state == 'success'

    steps:
      - uses: actions/checkout@v4

      - uses: actions/setup-node@v4
        with: { node-version: '20', cache: 'npm' }

      - run: npm ci

      - name: Run Checkly synthetic checks against deployed environment
        run: npx checkly test --env-var BASE_URL=${{ github.event.deployment_status.environment_url }}
        env:
          CHECKLY_API_KEY: ${{ secrets.CHECKLY_API_KEY }}
          CHECKLY_ACCOUNT_ID: ${{ secrets.CHECKLY_ACCOUNT_ID }}
          SYNTHETIC_API_TOKEN: ${{ secrets.SYNTHETIC_API_TOKEN }}

      - name: Block deployment if synthetic checks fail
        if: failure()
        run: |
          echo "❌ Synthetic checks failed — deployment to production blocked"
          echo "Check Checkly dashboard for details"
          exit 1
Monitoring-as-code project structure
monitoring/
  __checks__/
    api/
      health.check.ts          ## Health endpoint — every 1 min
      products-api.check.ts    ## Products API — every 5 min
      orders-api.check.ts      ## Orders API — schema check — every 5 min
    browser/
      homepage.spec.ts         ## Homepage LCP check — every 10 min
      pricing.spec.ts           ## Pricing page — every 15 min
    transactions/
      checkout-flow.spec.ts     ## Full checkout — every 5 min
      login-flow.spec.ts        ## Login journey — every 5 min
      onboarding-flow.spec.ts   ## New user onboarding — every 15 min
  alert-channels/
    pagerduty.ts               ## Critical alert channel
    slack.ts                   ## Warning alert channel
  checkly.config.ts            ## Global config
Treating monitoring scripts as code — reviewed in PRs, deployed with your application, tested in CI — eliminates the most common synthetic monitoring failure: checks that drift out of sync with the application they are monitoring.
7. What to monitor — and from where
Critical flows every production application should monitor
Authentication flow — Login with valid credentials should succeed in under 2 seconds. Login with invalid credentials should fail with the correct error message, not a 500 error. Session expiry should redirect correctly.
Core business transaction — For e-commerce: add to cart → checkout → order confirmation. For SaaS: create account → activate → access core feature. For content platforms: search → view content → engage. Whatever your application's primary value transaction is, that flow should have a transaction monitor.
API health and schema — Every production API endpoint should have a synthetic check verifying it returns 200, responds within SLA, and the response schema has not changed.
Key pages — Core Web Vitals — Homepage, pricing page, signup page, and product pages should have browser synthetic checks measuring LCP and detecting JavaScript errors.
Geographic testing strategy
Run synthetic checks from locations that match your actual user geography. A check that passes from us-east-1 can still fail for users in APAC due to regional infrastructure issues, CDN misconfigurations, or geo-blocking.
| User geography | Check locations to add |
|---|---|
| US-only users | us-east-1, us-west-2 |
| US + Europe | us-east-1, eu-west-1, eu-central-1 |
| Global | us-east-1, eu-west-1, ap-southeast-1, ap-northeast-1 |
| APAC-heavy | ap-southeast-1, ap-northeast-1, ap-south-1 |
A check that fails only from one region while passing from others immediately narrows the investigation to regional infrastructure — CDN edge nodes, regional database replicas, geo-specific routing rules.
8. Alerting strategy
Running synthetic checks without a well-designed alerting strategy generates either too much noise (alert fatigue — team starts ignoring alerts) or too much silence (missed incidents).
Alert routing by severity
Critical (page immediately):
  - Checkout flow failing from 2+ regions
  - Authentication failing from any region
  - Any API returning 5xx from any region
  - Health endpoint timeout > 30 seconds

Warning (Slack notification, no page):
  - Response time p95 > 150% of baseline
  - Single-region failure (may be regional blip)
  - LCP > 4 seconds on key pages
  - Non-critical API schema drift detected

Informational (dashboard only):
  - Response time 20-50% above baseline
  - Single check failure that resolves on retry
  - Scheduled maintenance windows
Avoid alert fatigue with these rules
Use multi-region confirmation for critical alerts. A checkout failure from one location might be a transient network blip. Alert on critical failures only when two or more regions fail simultaneously. This eliminates 80% of false-positive pages.
Add retry logic before alerting. A single failed check should retry once before triggering an alert. Two consecutive failures from the same region = alert. This further reduces noise from transient infrastructure issues.
Set maintenance windows for scheduled deployments. Silence synthetic check alerts during known deployment windows. An alert at 2am for a deployment that is actively in progress wakes people up for no reason.
Alert on trend, not just threshold. Response time gradually increasing from 200ms to 400ms over three days is a problem — but no single check ever breaches a 500ms threshold. Configure trend alerts in addition to absolute thresholds.
9. Common mistakes and how to avoid them
Mistake 1: Monitoring only uptime, not user flows
An uptime check that confirms your homepage returns 200 does not tell you whether the checkout flow works. Your application can be "up" — all endpoints returning 200 — while the core user journey is completely broken. Transaction monitors for critical flows are not optional for production applications.
Mistake 2: Running checks from only one location
A single-location check cannot distinguish between an application outage and a regional network issue. Always run checks from at least two locations, three for global applications. Single-location failures that do not reproduce from a second location are almost always infrastructure or network issues, not application failures.
Mistake 3: Letting synthetic scripts drift from the real application
The most dangerous synthetic monitoring scenario is a check that always passes because it is testing a flow the application no longer has. Scripts must be updated when flows change — when a button is renamed, a URL changes, or a step is added. The best protection is monitoring-as-code: when the application changes, the PR that changes it also updates the synthetic script. Reviewers see both changes together.
Mistake 4: Not using a dedicated synthetic user account
Running synthetic checks with a real production user account creates noise in your analytics, triggers real business events (emails, notifications, analytics conversions), and risks accidentally processing real transactions. Create a dedicated synthetic monitoring service account with clearly labelled data that can be filtered from analytics and excluded from business metrics.
// Always use clearly labelled synthetic test data
const SYNTHETIC_USER = {
  email: 'synthetic-monitor+checkly@yourapp.com',
  name: 'Checkly Synthetic Monitor',
  // Tag data so it can be filtered from analytics
  metadata: { source: 'synthetic-monitoring', environment: 'production' }
};
Mistake 5: Alerting on every single failure
A synthetic check that fails once and triggers a PagerDuty alert at 3am — only to self-resolve on the next run 60 seconds later — trains your on-call team to ignore alerts. Use retry logic, multi-region confirmation, and appropriate severity routing. Reserve pages for confirmed, sustained failures in critical flows. Use Slack notifications for transient or single-region issues.
10. Pre-launch synthetic monitoring checklist
Before going live with any new production service, confirm all of the following are in place.
Coverage
- Health endpoint check — every 1–2 minutes from 2+ regions
- All production API endpoints have uptime + schema checks
- Homepage and key landing pages have browser checks measuring LCP
- Core business transaction has a multi-step transaction monitor
- Authentication flow (login + logout) has a transaction monitor
- Third-party integrations have API checks (payment processor, email service)
Script quality
- All scripts use role-based / accessible name selectors (not fragile CSS classes)
- Scripts use a dedicated synthetic service account (not a real user account)
- Synthetic user data is clearly labelled and filterable from analytics
- Scripts stop before submitting real payments (use sandbox/test mode)
- Scripts are in version control alongside application code
Alerting
- Critical flows route to PagerDuty (or equivalent on-call platform)
- Non-critical checks route to Slack
- Multi-region confirmation required before critical alert fires
- Retry logic configured (2 consecutive failures before alert)
- Maintenance window automation configured for deployment pipeline
- Alert runbook documented (what to check when each alert fires)
Geographic coverage
- Checks running from at least 2 regions matching user geography
- Global applications covered across US, EU, and APAC
- Regional failure vs global failure routing configured differently
Frequently Asked Questions
What is synthetic monitoring?
Synthetic monitoring runs scripted simulations of user interactions against your application on a fixed schedule — from multiple geographic locations — to detect performance degradation, broken flows, and outages before real users are affected. Unlike Real User Monitoring, it runs continuously regardless of whether real users are active.
What is the difference between synthetic monitoring and Real User Monitoring?
Synthetic monitoring is proactive — scripted bots run on a schedule, independent of real traffic, providing continuous 24/7 monitoring. RUM is reactive — it collects data from actual user sessions, reflecting real behaviour but only when users are active. Best practice is using both: synthetic for immediate alerting and baseline SLA measurement, RUM for understanding real user experience trends.
What are the four types of synthetic monitoring?
Uptime/API monitoring (HTTP checks verifying endpoints respond correctly), browser synthetic monitoring (full page rendering measuring Core Web Vitals), transaction monitoring (multi-step user flow scripts simulating complete journeys), and API synthetic monitoring (validating response schemas and SLAs on a schedule).
How often should synthetic checks run?
Uptime and API checks: every 1–5 minutes. Browser checks on critical pages: every 5–15 minutes. Transaction monitors for critical flows: every 5–15 minutes. The right frequency matches your acceptable time-to-detect — if a 5-minute outage is unacceptable, run checks every 1 minute.
What is the best synthetic monitoring tool in 2026?
Checkly for developer-led teams wanting monitoring-as-code with Playwright. Datadog Synthetics for teams already in the Datadog ecosystem. Robonito for teams that want transaction monitors auto-generated from existing test flows. Uptime Robot for simple, budget-friendly uptime checks. The right choice depends on your existing toolchain and monitoring sophistication.
Can synthetic monitoring completely prevent downtime?
No. Synthetic monitoring detects problems faster than user reports — typically within 1–5 minutes of a failure occurring — enabling faster response. But detection is not prevention. It reduces the impact window of incidents, not their occurrence. Combined with good deployment practices, feature flags, and rollback capabilities, it is part of a reliability strategy, not a substitute for one.
External references
- Checkly Documentation — Monitoring-as-code platform
- Datadog Synthetic Monitoring — Official Datadog docs
- Google Core Web Vitals — LCP, INP, CLS benchmarks
- Playwright Documentation — Browser automation used in synthetic checks
- PagerDuty State of Digital Operations 2025 — Incident response data
- Grafana k6 Browser Checks — k6 browser synthetic monitoring
- New Relic Synthetics — Enterprise synthetic monitoring
Turn your existing test suite into production synthetic monitors
Robonito runs your functional tests as continuous synthetic monitors in production — the same flows that pass CI now watch your live application 24/7, alerting your team the moment a critical journey breaks. Start free at Robonito.com →
Automate your QA — no code required
Stop writing test scripts.
Start shipping with confidence.
Join thousands of QA teams using Robonito to automate testing in minutes — not months.